

Most established businesses build their website the way they'd describe themselves at a dinner party (who we are, what we do, the team, how to reach us), and then wonder why a site with healthy traffic produces so few enquiries. A buyer moves through it in a different order, set by the questions they need answered before they'll pick up the phone. Friction Mapping is how we pin down where those two orders collide.
What friction looks like on a website
Friction is anything that makes a visitor who was ready to keep going hesitate, go back to check something or leave. Design reviews miss most of it. Each page looks fine on its own, and the problem sits in the gaps between them. Think of a pricing question that only gets answered on page four, or the one case study that proves exactly the right thing sitting behind a link in the footer. A contact form that asks for a budget before the visitor has seen anything suggesting you're worth one does the same damage at the very last step.
Mapping it against the buyer's questions
The map starts with the buyer, before anyone opens the site. We list the questions a serious prospect needs answered before they'll make contact, in the order they ask them. Some get asked out loud: do you do this kind of work, have you done it for someone like me, roughly what does it cost? Others never do (who will be doing the work day to day, what happens if it goes wrong, whether a business your size is too small for us), and those are the ones a website has to answer without being asked.
Then we walk the existing site against that list and mark where each answer appears, how far into the journey it sits and how convincing it is when the buyer gets there. Missing answers are easy to spot. Late ones take more work to find, because the information exists but arrives three clicks after the buyer needed it. We also look for the decision triggers, the specific proof point or detail that tips someone from browsing to booking a call, and check whether it's anywhere near the moment they'd act on it.
Where the analytics fits
Analytics shows where people leave, and the map explains why they left. Read side by side, a high exit rate on a service page often traces back to a question the buyer needed answered on that page and never reached. We've written separately about reading your exit data if you want the detail on that half.
Try it on your own site
You can run a rough version of this yourself in an hour or so. Start with the five questions your best client asked before they signed, in the order they asked them, plus the one they were probably too polite to ask. Order matters as much as the questions. Then open your site on your phone and count the taps it takes to reach a convincing answer to each. Anything that takes more than a few taps, or gets answered with an adjective instead of a fact, goes on your list. The list is a rough friction map. Some of what's on it can be fixed with copy and page order long before anyone mentions a rebuild.
Heritage Saunas: a site with nothing to show
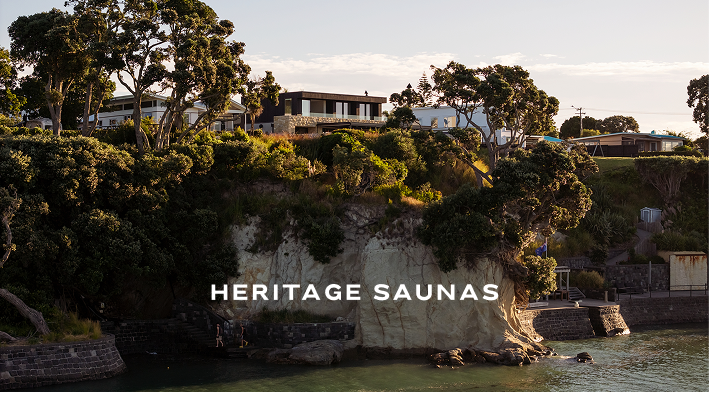
Heritage Saunas came to us with about as obvious a friction point as a brief can have. There was no finished sauna to show anyone. An architect or homeowner weighing up a premium custom build wants to see the product, and what we had was a material palette, the craft behind it and a founder's conviction. So the site was planned around the questions a photograph normally answers (what it's made of, how it's built, what it would feel like to sit in one). Material detail and atmosphere did that work instead. Within three months of launch, with no paid advertising, it was bringing in two to three qualified leads a week, and it converts enquiries at 4.6% against a 2.7% industry benchmark.